You’ve spent many hours building a sophisticated sales funnel.
Now it’s time to analyze the conversion funnel metrics to figure out if it’s working to meet your business goals. There’s only one problem. There are so many metrics you have to keep track of that you’re getting overwhelmed.
So how about we make it easy by focusing on only 5 conversion funnel metrics that directly impact your bottom-line?
Track the data these 5 metrics provide to find out where funnel leaks are and to decide what to focus on to meet your sales goals.
These 5 metrics are:
1. Sales Conversion Metric
Imagine meeting a friend who looks pale and disorientated. Your immediate thought is most likely that there’s something wrong.
That’s what it’s like when you look at the sales conversion metric. You see the numbers and you immediately get an idea of the state of things. It tells you how many of the leads that enter your funnel have turned into paying customers.
Here’s the formula to measure sales conversion:
sales conversion rate = (number of sales / total number of visitors ) * 100
Track the sales conversion metric every month instead of waiting until the end of the year. This way, you can immediately see any dips or rises in sales. Check its trajectory every month and you get an overall idea of your funnel’s health.
Apart from the overall sales conversion metric, also keep track of the conversion rate for each stage of the funnel. This means gathering data on how many of the leads turn into qualified leads and then into paying customers.
Doing this allows you to see where the possible bottlenecks are. This then gives you actionable insights to optimize your sales pipeline.
2. Desktop vs. Mobile Conversion
There’s a good reason why mobile conversion is not at the same level as that of desktop devices. User intent is different. Desktop users are more often in the buying state of mind than are mobile users.
But just because most mobile users aren’t ready to buy doesn’t mean you shouldn’t optimize your site for them. A good percentage of these users will convert if you lessen friction points and give them enough motivation to buy.
So here’s what you do.
Go to Google Analytics and compare the desktop vs. mobile conversion in your funnel. You’ll likely find that visitors on mobile devices do not convert as much as the visitors who visit your site through their desktop devices.
But here’s where this becomes useful to your business. Study the journey that your mobile users take from the top of the funnel to the bottom of the funnel. Where do most of them drop off?
When you have this data, you can then make educated guesses on possible reasons why mobile users are leaving without converting. This will help you identify the direction of your next optimization tests.
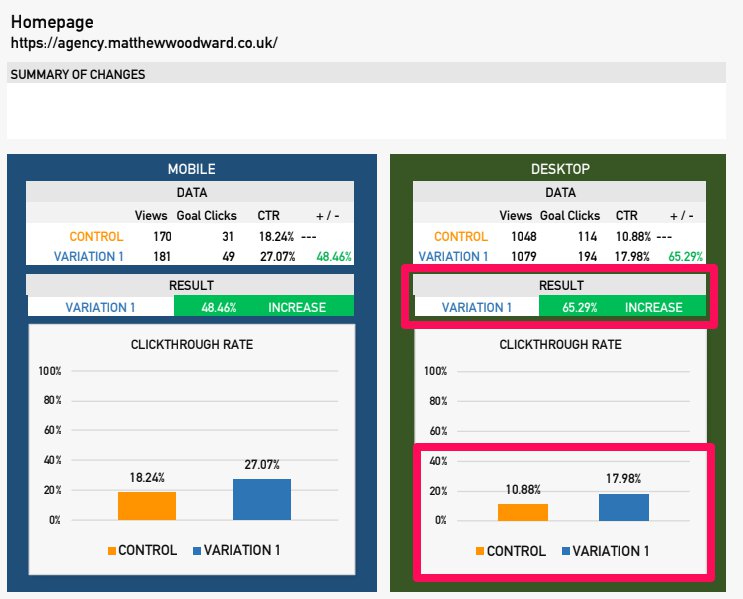
This was what we did when we worked on Matthew Woodward’s agency which led to mobile conversion increases as high as 48%.

Are you excited yet? Great. Here’s a video on where to find the data for mobile conversions on Google analytics and what you need to look out for.https://www.youtube.com/embed/7WBJcRZ_iVY?feature=oembed
3. Sales Velocity
It’s easy to get confused by the word sales velocity. You’d think it’s going to show you the speed at which a lead turns into a sale. Yet sales velocity is expressed in terms of dollars. Not speed.
Let me explain.
Here’s the formula to calculate sales velocity:
Sales velocity = (number of opportunities * Average Deal Size ($)* Conversion Rate) / Sales Cycle Length
And here’s an example of that equation using real numbers. – Read More


