

Wondering if the people you send to your website find what they’re seeking? Want insights to improve the customer journey?
In this article, you’ll discover how to analyze your website visitor engagement in Google Analytics. You’ll also learn how to see which audience segments spend more time on your website and find opportunities to adjust what visitors see when they first land on your site.
To learn how to use three Google Analytics reports to discover how people engage with your website, read the article below for an easy-to-follow walkthrough or watch this video:https://www.youtube.com/embed/g3YZW2LQraQ?enablejsapi=1&origin=https%3A%2F%2Fwww.socialmediaexaminer.com
Google Analytics and the Customer Journey
Before we jump into analytics, let’s talk about why you’d use Google Analytics in the first place. Think about it in terms of a conversation. People are coming to your site and your site is having a conversation with them to hopefully get them to become customers.
If you think about it, that’s what happens when people visit an offline store. They have to interact with a salesperson who helps them purchase their products. Your website is basically doing the same thing and Google Analytics is how you can listen for that conversation and understand how users are interacting with your website.
Another way to think about the conversation is engagement. In Google Analytics, you can look at a report and see the engagement level of website visitors. If they’re not engaging at all, it means they’re having a bad conversation and you might want to change some of the marketing messages. If they’re engaging a lot, you’d expect that they would ultimately become purchasers.
Now let’s look at Google Analytics reports where you can find this data.
#1: Analyze Website Visitor Engagement by Traffic Source in Google Analytics
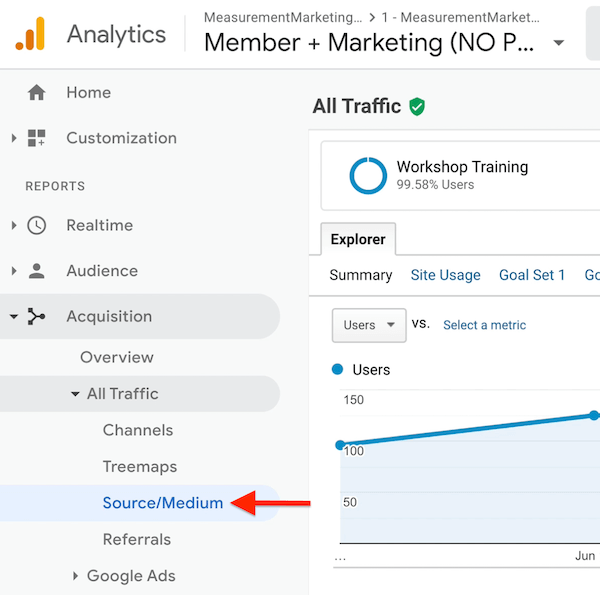
Start by jumping into my favorite report: the source/medium report. From the Google Analytics home screen, go to Acquisition > All Traffic > Source/Medium in the left navigation.
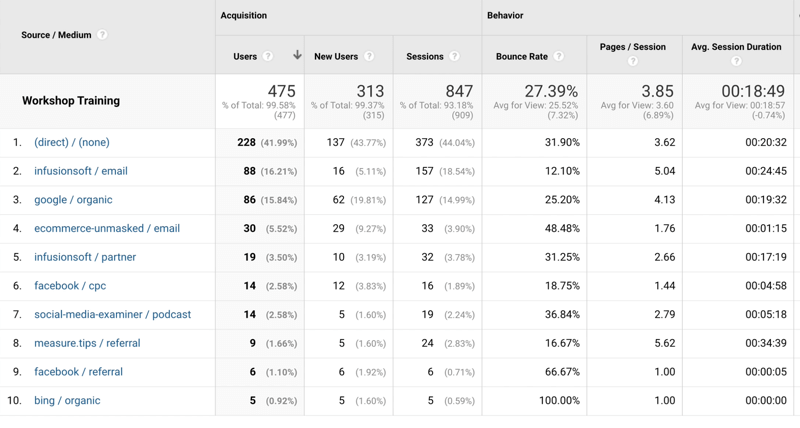
The source/medium report tells you where your website traffic is coming from and the amount of traffic you’re getting from these different traffic sources. It also shows your engagement metrics, and ultimately, the results of all of that engagement.
If your report doesn’t look like mine, that’s because I’m using something called UTMs. Make sure you’re properly using UTMs to tag your traffic as well. Read this article to learn how to set up UTMs.
In the source/medium report, we’re going to focus on the Behavior section, which includes three main metrics for engagement:
- Bounce rate tells you how many people came to your site and left without seeing another page.
- Pages per session is how many pages people saw during their visit to your site.
- Average session duration is how long people stuck around.
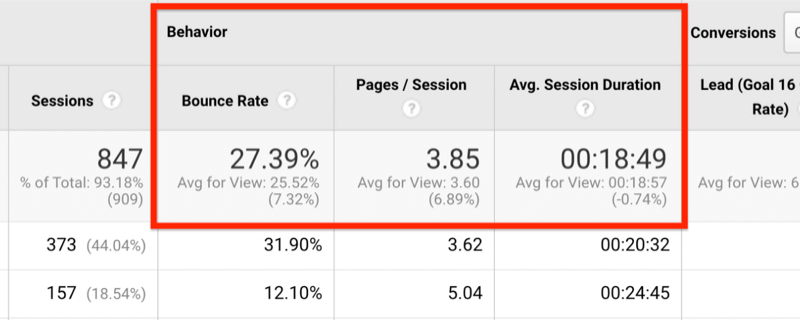
At the top, you can see the bounce rate, pages per session, and average session duration for the site as a whole.
Below the sitewide numbers, the report breaks down these metrics by traffic source.
Bounce Rate
While it’s helpful to know that the bounce rate is 27% sitewide, you can’t really do anything with that information. You’ll need to drill down by traffic source.
In the image below, you can see that the bounce rate for direct/none is 31% and for infusionsoft/email, it’s 12%. So the bounce rate for people coming directly to the site is about the same as the sitewide bounce rate. The infusionsoft/email traffic, however, is about half that. The people coming to the site from email are twice as engaged as the people who are coming there directly.
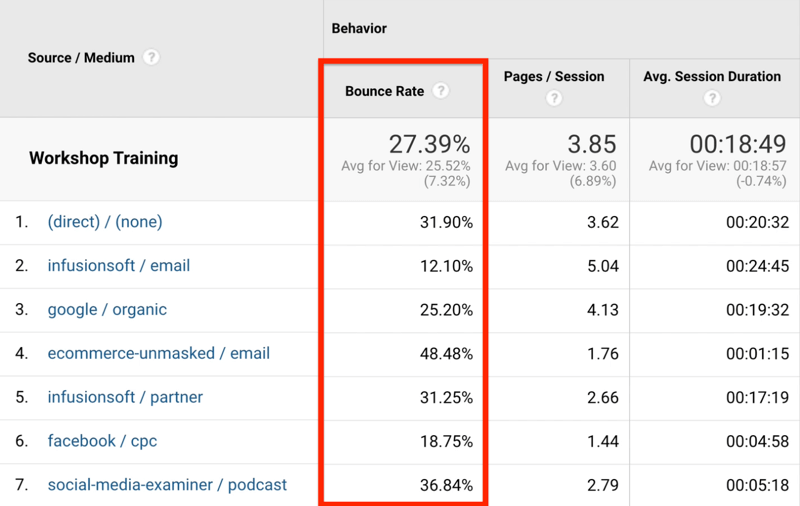
What about the other traffic sources? The bounce rate for search traffic (google/organic) is 25%, which is about the same as the overall site traffic but not as engaged as email traffic. This is about what you’d expect because these visitors probably just recently heard about the business and therefore aren’t as likely to engage.
Email traffic, on the other hand, has heard about the business. They already know, like, and trust the brand and are coming back again and again. I’d expect the bounce rate to be lower because you’re having a better conversation with this particular traffic source, and according to this data, it looks like that’s the case.
If you look at the other email—ecommerce-unmasked/email—the bounce rate is much higher at 48%. What’s the difference? They’re both email so shouldn’t the bounce rate be about the same?
The difference is that infusionsoft/email is an internal list. These are customers and leads so they understand the brand, are coming back to the site over and over, and are much more engaged. Ecommerce-unmasked/email, on the other hand, is people who don’t know about the business yet. They’re in the early stages of working with the business so a higher bounce rate is expected.
Pages per Session
Now let’s move on to pages per session. Below, you can see that infusionsoft/email is at 5 pages per session, while the sitewide number is almost 4. This means visitors coming from email are seeing a lot more pages when they visit the site.
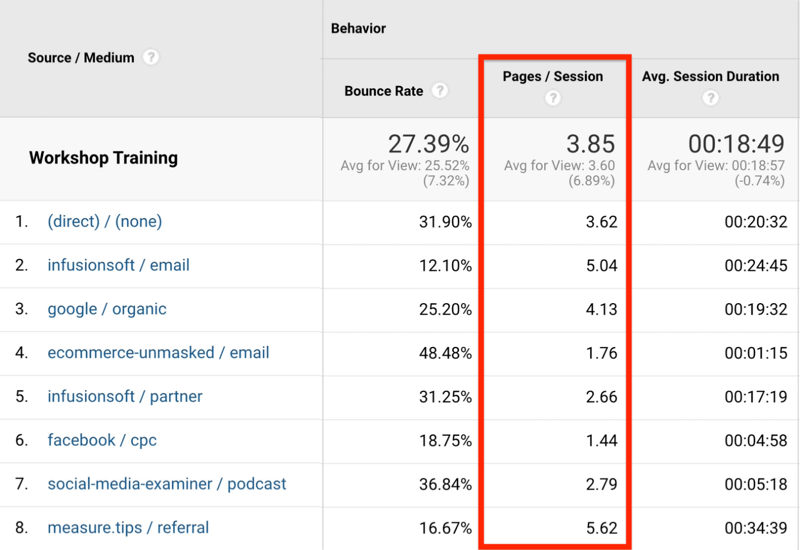
You already know that the other email source—ecommerce-unmasked/email—has a high bounce rate and looking at pages per session provides even more detail. Instead of viewing 5 pages on average per visit, these visitors are barely seeing 2. They’re coming and going quickly so the targeting for this particular email may need to be adjusted.
Other traffic sources like organic have a higher bounce rate than email, but these visitors are exploring 4 pages per session on average, which is higher than the sitewide number.
This data says to your business that organic is okay. People are searching for problems, finding the site as a possible solution, and when they come to the site, some of them bounce, which is okay. But the pages per session number tells you they’re sticking around and checking out a number of pages, which means they’re going through the different offers and exploring the site.
So what’s the conversation quality with these website visitors? It’s a better conversation because the business is engaging them more. That’s a good sign.
Average Session Duration
The third metric we want to look at is average session duration. In the image below, you can see that people spend about 19 minutes on average with the site for each session.
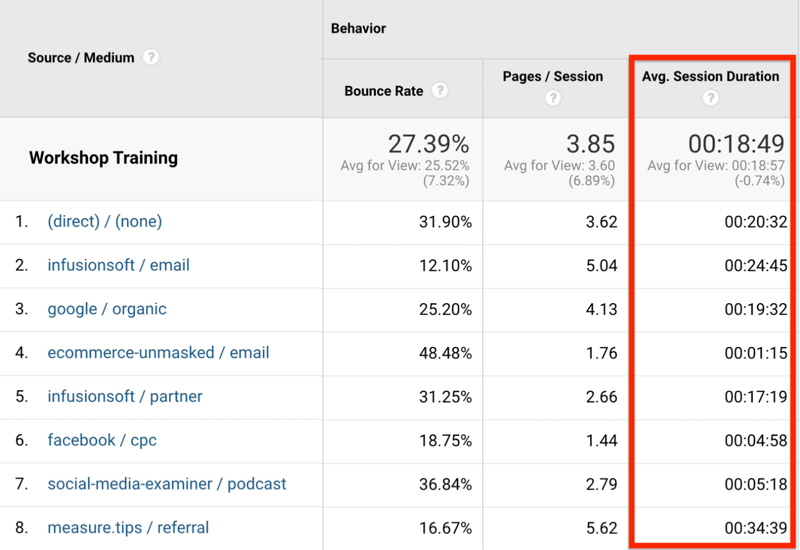
Now let’s look at the different traffic sources. From the analysis above, you know that infusionsoft/email traffic is highly engaged because the bounce rate is low. Pages per session tells you that these visitors are seeing a lot of pages. And, finally, the 24 minutes on site is a lot higher than the sitewide average (18 minutes). The takeaway is that the conversation with the company’s email list is good. – Read more