
 Google Analytics is the primary measurement platform for millions of websites and digital marketing campaigns.
Along with Google Search Console and other third-party measurement tools and platforms, Google Analytics provides insight into key metrics on your audience, organic search, paid search, social media, and website performance.
While it is a given that Google Analytics is a part of our daily routines for monitoring performance and reporting, we can get into a routine of just going in and getting the stats and using the reports we always have.
Or, for those who only rely on a few key metrics and aren’t well versed in all that Google Analytics has to offer, take a moment to see if any of these 11 reports can help you.
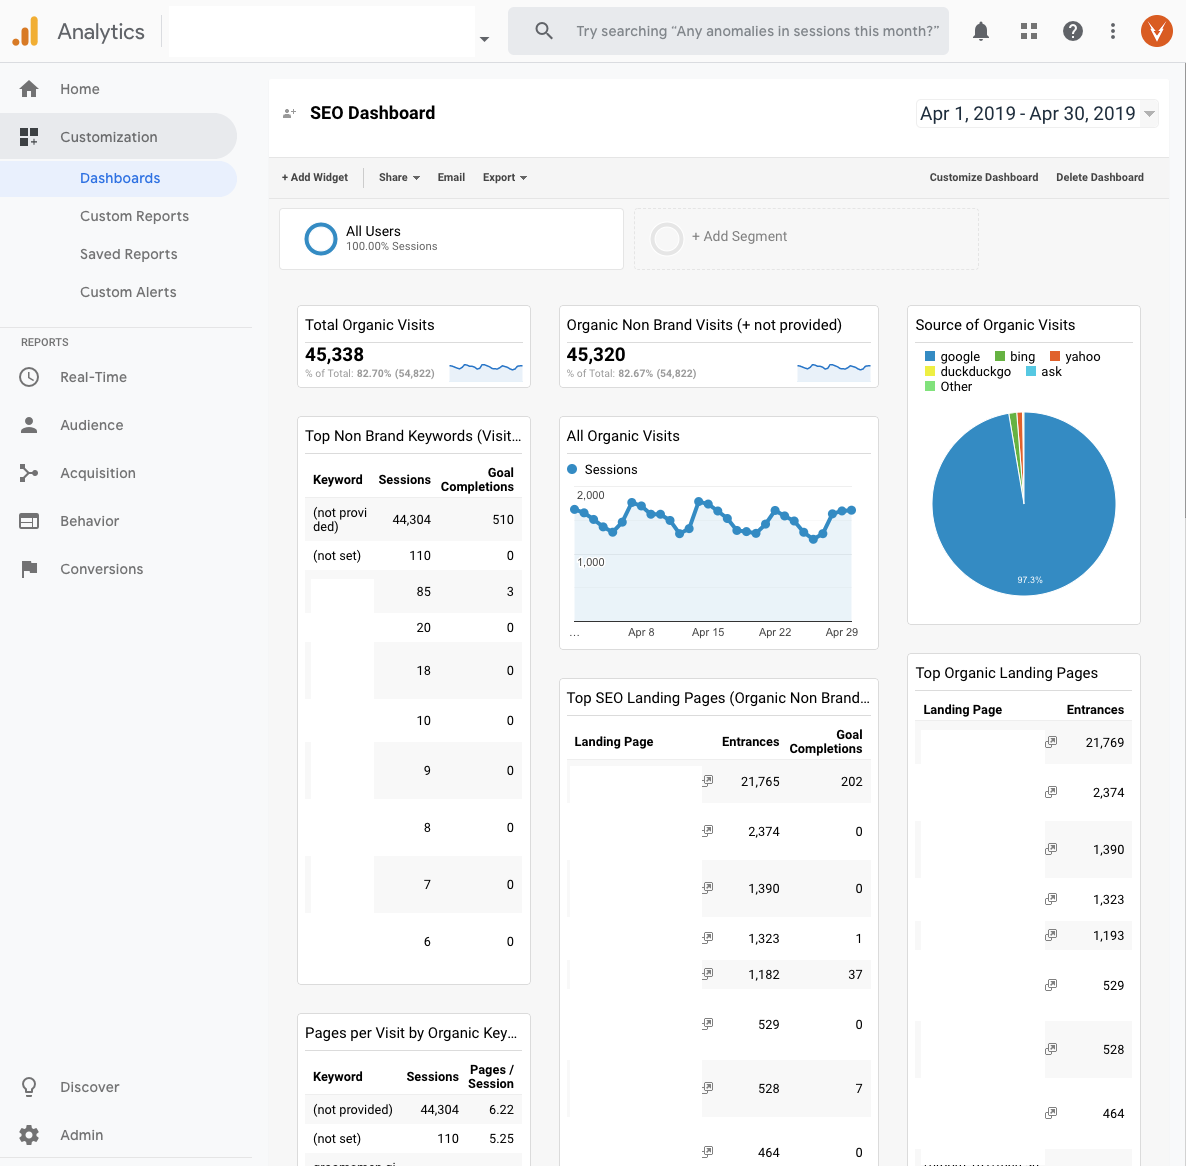
1. Custom Dashboards
How many times do you jump into Google Analytics to find the same report, same stats, or slice of data?
How many times do you have to answer the same question for a stakeholder?
If more than once, then custom dashboards are for you.
You can create custom dashboards from pretty much any data view you can drill down into in Google Analytics. Plus, you can add data and reports in widget format from multiple reports into one page.
This is a big time saver. It can also be scheduled for automatic export and delivery to you or key stakeholders once you have it set up the way you want it.
This is a great starting point before jumping over to Google Data Studio, where you can do even more.
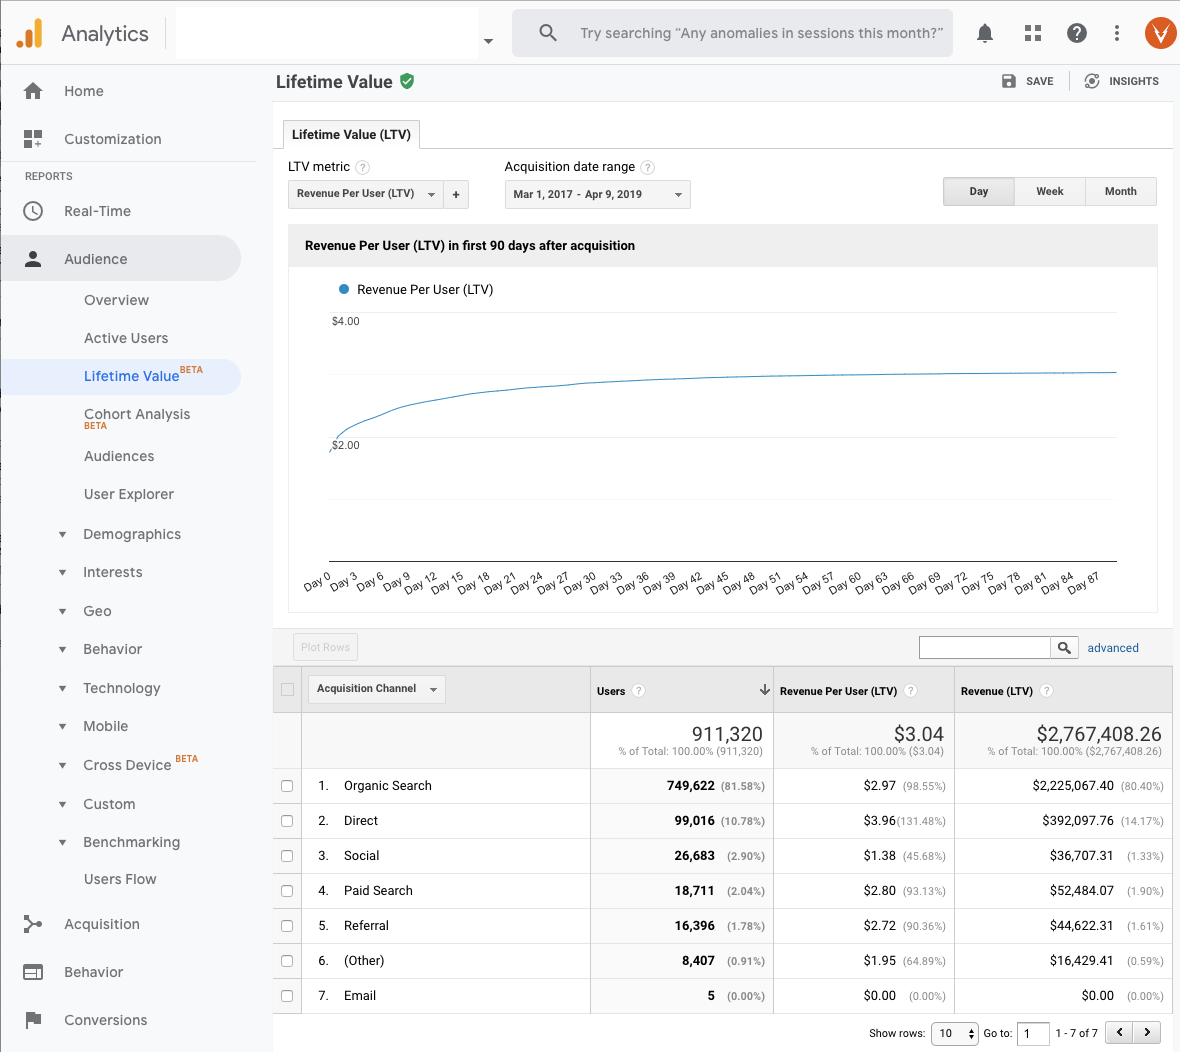
2. Lifetime Value
This report still has the “beta” tag in Google Analytics. However, over time, I’ve found more use for it in sites that have a lot of engagement within the 30-90 day cookie window that Google Analytics can track.
If you have a site that engages users and that they come back to often to make one or more purchases, you can track the value of specific users and factor this in with other aspects of the buyer’s journey that you’re measuring.
Note that when something is in beta, I keep in mind that the report could be updated, enhanced, removed, or that data could change over time, so beware.
3. User Explorer
User explorer allows us to drill down into the journeys of specific website visitors.
While we can’t personally identify the user in Google Analytics by default (and be careful if you try to match up data as Google has specific guidelines on this), we see how individual users consumed content and acted within the website over a period of time.
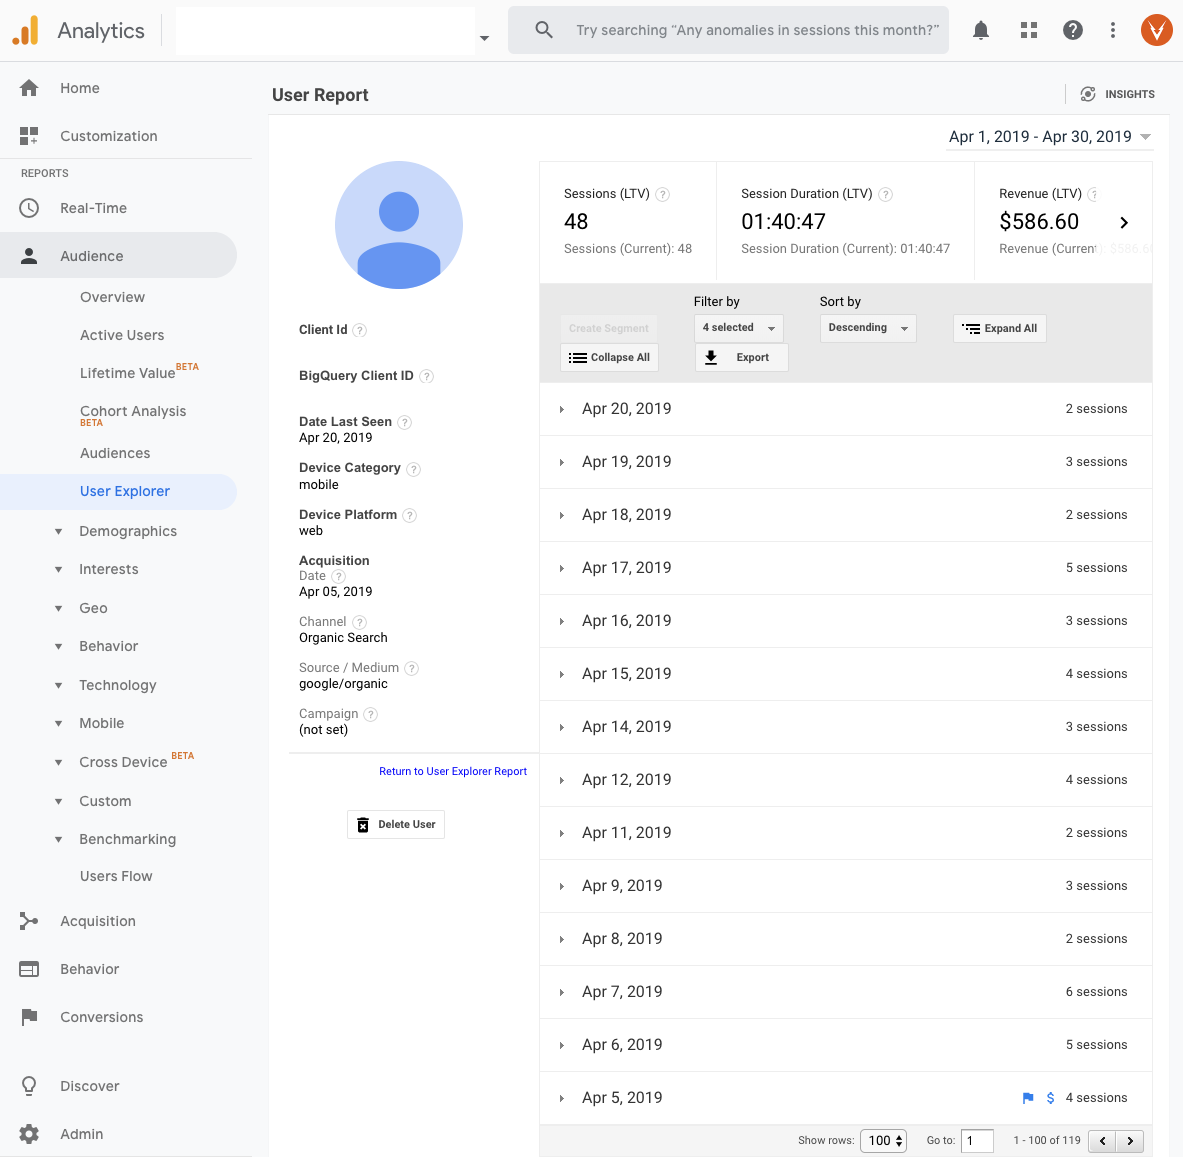 This information isn’t necessarily as powerful as some third-party user recording and heat mapping tools but it provides some aggregation and insight that rolls up revenue data and other standard Google Analytics metrics in a single report.
Being able to see individual user journeys – including the number of sessions, what pages/activities they did during them, and ultimately when they purchase or make a decision – can help with user experience and conversion rate optimization.
It can also help set expectations for marketing activities and how many steps are realistically part of the customer journey.
4. Interests – Affinity Categories
The Interests/Affinity Categories report can be really interesting and helpful across a wide range of uses.
If you don’t see data by default, you have to simply agree to the terms and give Google authorization to show it for your account.
The categories shown may or may not align with what you expect.
You can leverage these categories by:
- Further drilling down into them to understand behavior.
- Sharing this data with those running paid search or social media campaigns and writing content targeting specific audiences.
- Comparing the segments to each other.
Finding opportunities to leverage specific audiences and segments is powerful when tuning your content strategy.
This data provides a lot of options for adding dimensions and slicing and dicing the views. It can be a great starting point for spending some in-depth time looking at:
- Who your current audience really is.
- How they convert.
- Where you should prioritize your efforts across the digital marketing spectrum.
5. Benchmarking – Channels
If you’ve ever wondered or been asked about how your website performance compares to others in your industry, the benchmark report is a hidden gem that can help.
You can select some pretty detailed industry verticals and see how your site compares across the different channels in the standard Google Analytics traffic metrics.
This is great data to use to set a baseline and establish goals if you’re struggling to determine how to do so.
It can be a lot more helpful and fun to put some real competitive targets in place rather than looking inward or arbitrarily setting goals that may or may not be realistic. – Read more